

Mapping Neighborhood Change in Southern California: Los Angeles, Orange, and San Diego Counties
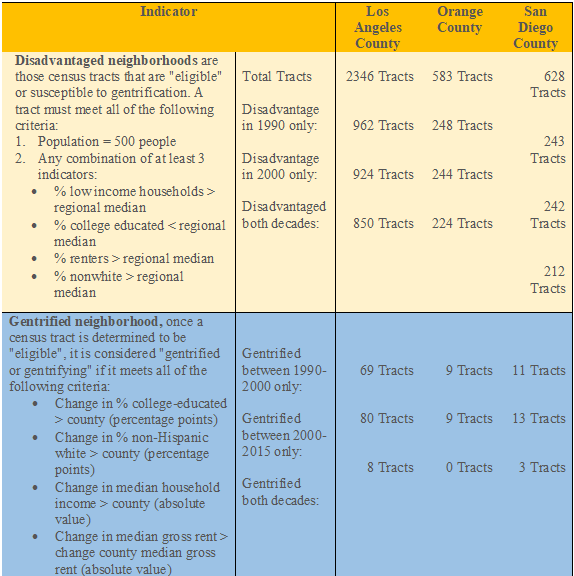
In 2016, the UCLA Urban Displacement Project team developed a neighborhood change database to help stakeholders better understand where neighborhood transformations are occurring and to identify areas that are vulnerable to gentrification and displacement in Southern California. The final version of this database (updated in July 2018) includes Los Angeles, Orange, and San Diego Counties, with gentrification and sociodemographic indicators based on 2015 data from the American Community Survey. It shows whether each Census tract comprising these three Southern California counties gentrified between 1990 and 2000; gentrified between 2000 and 2015; gentrified during both of these periods; or exhibited characteristics of a “disadvantaged” tract that did not gentrify between 1990 and 2015.
Based on this neighborhood change database, the UCLA team found that the number of gentrified Census tracts in Los Angeles County increased by 16% between 1990 and 2015. The share of gentrified neighborhoods in San Diego County increased by 18% over this same period. Of the three counties, Orange County exhibited the greatest share of neighborhoods that were considered to be “disadvantaged” and potentially susceptible to gentrification (~43%).
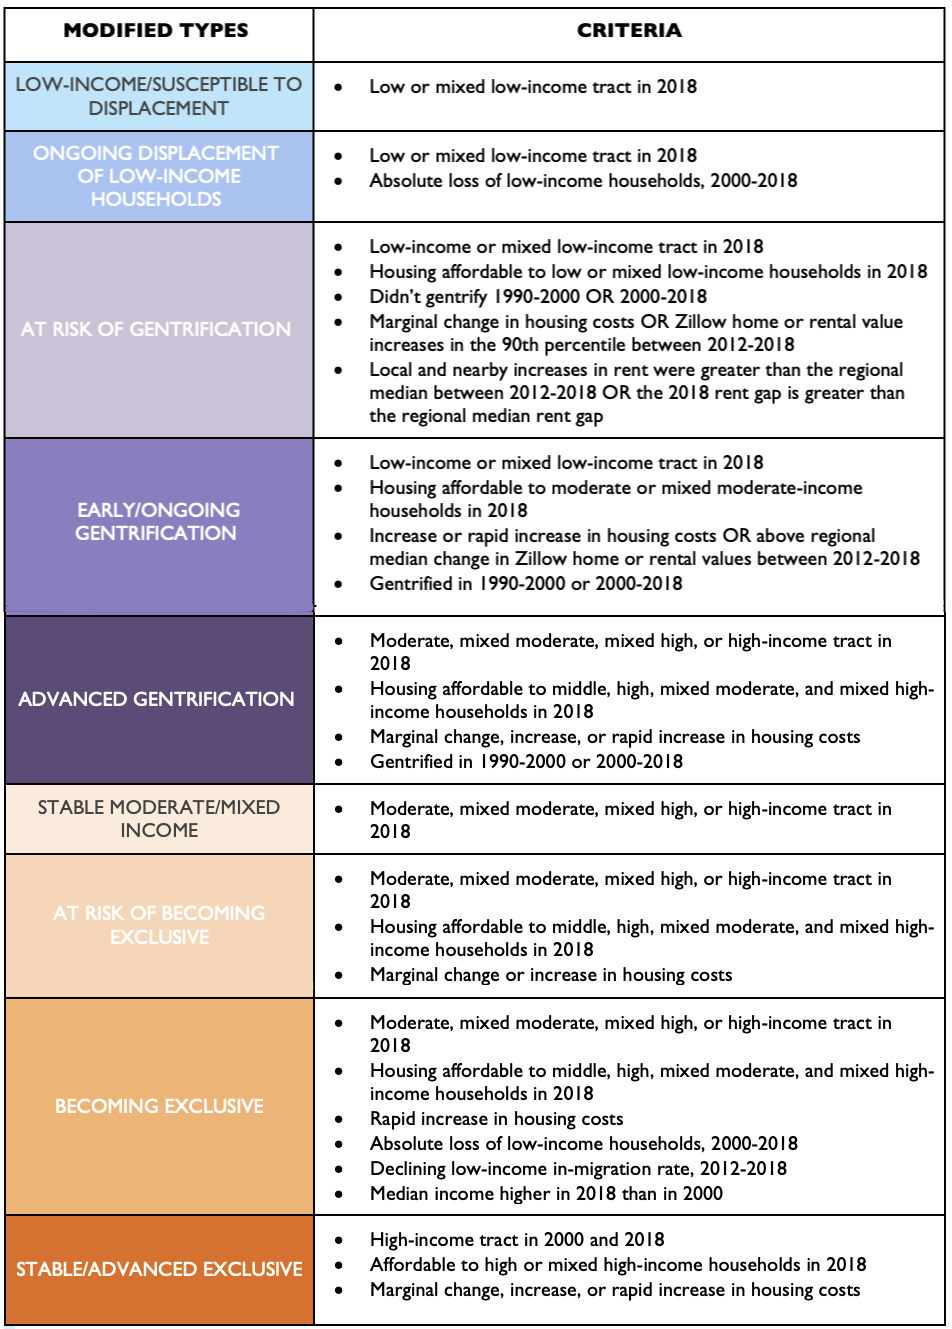
In 2020, the UDP team in the San Francisco Bay Area collaborated with their UCLA partners to produce an updated neighborhood change map of the three Southern California counties and identify COVID-19-related risk. This updated version employs the same displacement typologies that UDP used to create their most recent maps of Chicago, Atlanta, Denver, and Memphis, and San Francisco. It uses 2018 data from the American Community Survey and incorporates adjustments to the typology methodology based on feedback from researchers and equitable development stakeholders in several US regions. The map also displays a series of indicators developed by the UCLA team to model the impact of the COVID-19 pandemic on neighborhoods across the region.
Key Findings from the 2018 Map
- Los Angeles County exhibited the highest rates of gentrification, with 10% of tracts classified as At Risk of Gentrification, Early/Ongoing Gentrification, or Advanced Gentrification. In addition, 5% of tracts in Los Angeles County were not gentrifying but experienced Ongoing Displacement of Low-Income Households.
- Orange County had the highest rates of exclusion, with 55% of tracts exhibiting either exclusion risk or ongoing exclusion. 29% of tracts in Orange County were classified as Stable/Advanced Exclusive, the highest level of exclusion.
- In San Diego County, 7% of tracts experienced risk of or ongoing gentrification/displacement. 51% of tracts exhibited some phase of exclusion, including 23% classified as At Risk of Exclusion of lower-income households in the future.
- A new set of layers examines five dimensions of vulnerability (see the UCLA Center for Neighborhood Knowledge report, California Neighborhoods and COVID-19 Vulnerabilities): (1) which communities are most at risk from job displacement in the hospitality, retail, personal care, and service sectors; (2) which communities are at risk due to a disproportionate high percentage of residents not enrolled in Unemployment Insurance (UI) benefits; (3) which communities have high numbers of renter households that are experiencing extreme financial hardships; (4) which communities are most burdened by shelter-in-place mandates; and (5) which communities are likely to be unrepresented in the 2020 Census due to low response rates.
Reports on COVID-19 and Housing Stability
- Read UCLA’s work on systemic racial inequality and the renter and homeowner housing crises during the coronavirus pandemic. Learn more about the COVID-19 Equity Research Initiative at the news and publications pages.