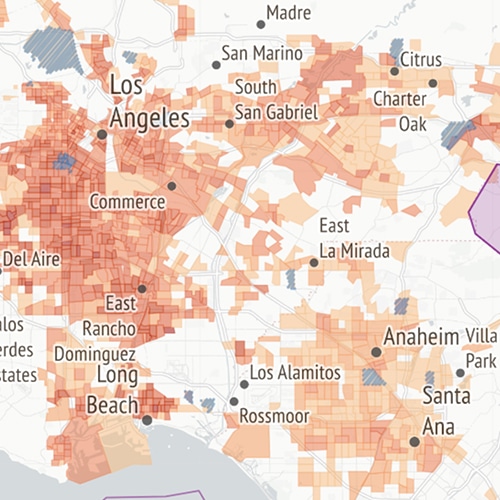
Displacement occurs in cities and regions around the world, due to the lack of policies and programs to stabilize communities in the face of investment and disinvestment by both the private and public sectors. Urban Displacement Project faculty, students, and partners have mapped patterns of neighborhood change–including displacement, gentrification, and exclusion–around the world relying primarily on secondary data from the census. We welcome contributions from academics as well as public and nonprofit organizations who wish to add their own maps to our site.
Displacement affects not just neighborhood residents but local businesses and cultural organizations. In this set of research projects, we describe and analyze the many ongoing forms of displacement that uproot communities, from the industrial displacement that dislocates middle-wage jobs, to the cultural displacement that occurs as rising rents continually push out artists, mom-and-pop stores, and arts organizations, to commercial displacement that happens as entire corridors gentrify.
The Housing Precarity Risk Model (HPRM) estimates where households are at the highest risk of eviction, displacement, and long-term poverty as a result of the COVID-19 recession interacting with pre-existing precarity. The aim of this work is to better understand racial and economic disparities in housing and opportunities while providing state and local governments a tool to target needed resources to those that need it most. The eviction side of this research is a continuation of The Evictions Study where we collect and scrape court record data to observe eviction dynamics in under-represented areas.
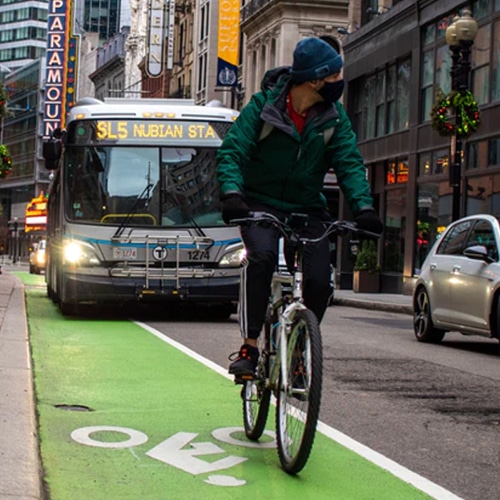
In the face of climate crisis, cities are trying to reduce their carbon footprint through investment in transit, active transportation, parks and parkways, and infill development. Yet, these climate mitigations may create land value uplift that destabilizes communities. Our research on climate displacement examines the nature of these impacts and provides tools for communities to assess their own risk.
Our research related to climate and displacement covers three diverse areas: climate displacement, climate mitigation, and infill development. Our climate displacement studies examine the direct impacts of climate change and disasters on residents. Our climate mitigation research shows how public investments in transit, transit-oriented development, active mobility, and parks impact community stability; we also include a set of studies on the effectiveness of regional planning for sustainability and equity. Our infill development studies examine the impact of new housing production on displacement, and the potential for both small-scale (i.e., accessory dwelling units) and urban infill.
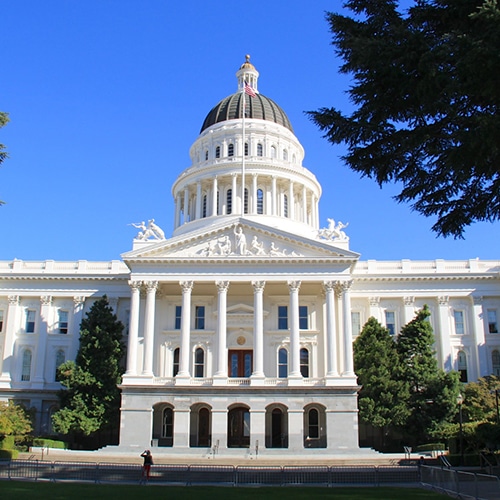
Anti-displacement policies can mitigate the impacts of investment and disinvestment on communities. Many local governments have innovated approaches to keep residents and businesses in place. This research area profiles and evaluates these policies and programs from around the world.