

Mapping Displacement, Gentrification, and Exclusion in the San Francisco Bay Area
In 2015, researchers at UDP collaborated with the San Francisco Mayor’s Office of Housing and Community Development to better understand and predict where gentrification and displacement was happening and would likely occur in the Bay Area through a community-engaged research process. These efforts culminated in the creation of interactive gentrification and displacement typology maps that summarized housing market dynamics and displacement and gentrification risk into categories (“typologies”) at the census tract level. The goal of these maps, as well as complementary in-depth case studies of 9 Bay Area communities was to help frame conversations around issues of gentrification, displacement, and exclusion and to inform strategies to mitigate the negative impacts of housing instability.
Building upon continued gentrification and displacement analysis for other regions both nationally and internationally, in 2018, UDP partnered with the Strong, Prosperous, and Resilient Communities Challenge (SPARCC) to assess local dynamics around gentrification, displacement, and exclusion in four of its six target regions, specifically Atlanta, Chicago, Denver, and Memphis. Working in collaboration with local research and community partners, UDP made the following high-level improvements to the original typologies:
- Used mixed income categories and market type designations to classify tract-level income levels.
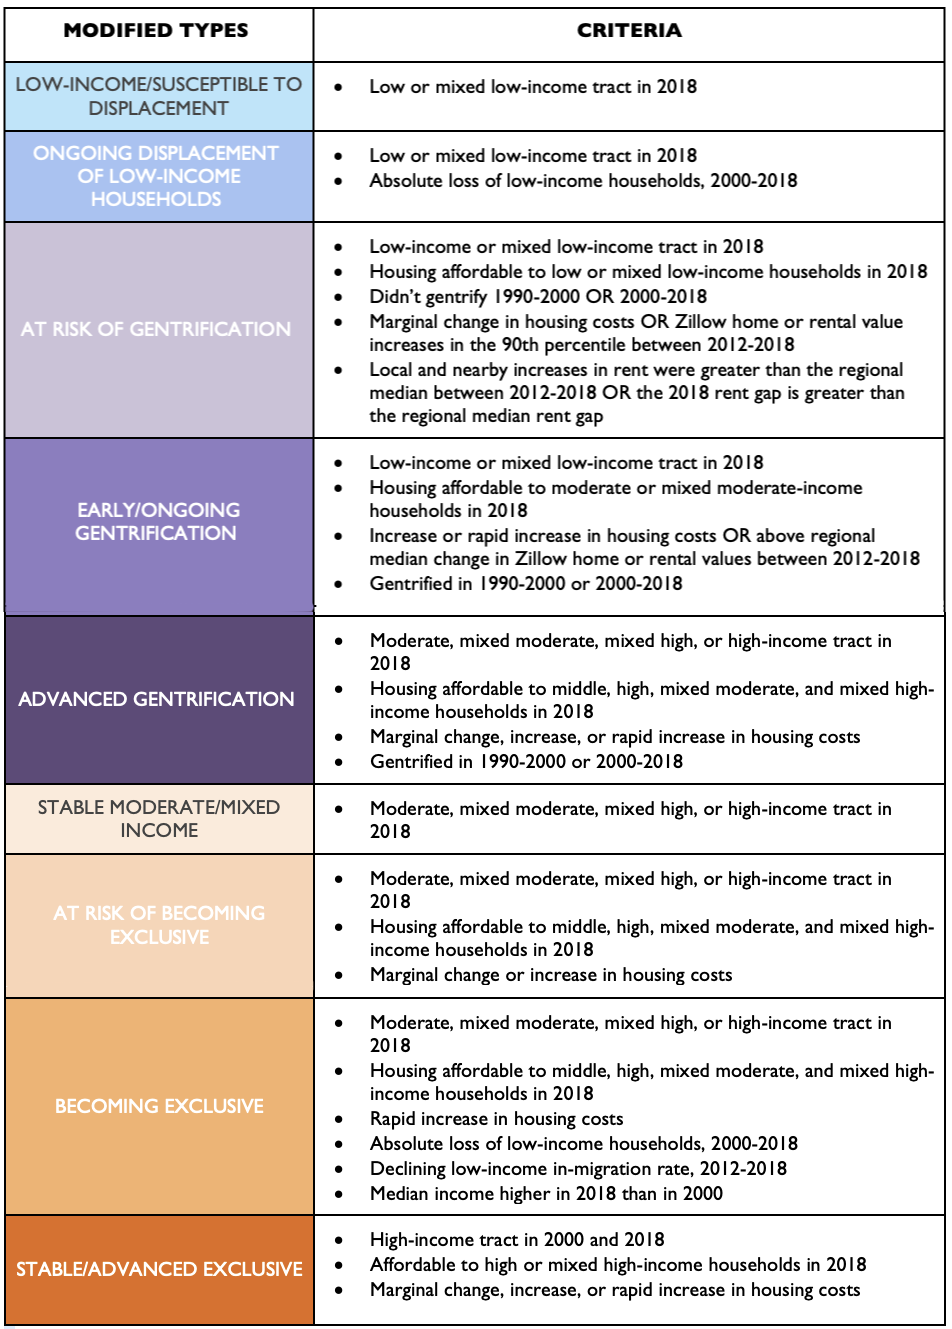
- Added new typologies, including the ‘Ongoing Displacement,’ ‘Stable Moderate/Middle Income’, and ‘Stable Advanced Exclusive’ categories.
- Included short-range shifts in rental and home value data to accompany long-range change measurements
- Considered ‘extra-local’ factors, including rent gap measures and the change in rent of surrounding tracts.
Reapplied to the Bay Area, this methodology helps shed light on recent neighborhood change dynamics, as well as patterns undisclosed in original typology maps. We note, however, that our results do not always coincide with impressions “on the ground” for several reasons. For example, though we categorize census tracts as just one neighborhood change type, different types of change may be occurring in particular blocks or block groups. Also, we do not account for public or subsidized housing in the analysis; including these low-income stable residents in the analysis may push the neighborhood out of the gentrification category into another low-income type.
The main takeaways from this analysis are included below.
Key Findings
- As of 2018, over 10% or 161,343 low income households (households making below 80% of AMI) lived in areas at risk of or currently experiencing gentrification. Nearly half of these households live in either Alameda or San Francisco counties.
- However, consistent with other SPARCC cities, less than 10% of all tracts in the Bay Area are classified as either at risk of or experiencing early or advanced gentrification, suggesting that gentrification is not as prevalent as other forms of neighborhood change. Gentrification risk or occurrence varies by county, however. Ongoing and advanced gentrification is most prevalent in San Francisco (18.5% of all tracts) and Alameda (11.1% of tracts) counties, and least prevalent in Contra Costa, Sonoma, and Yolo counties, mainly due the absence of densely populated, urban tracts.
- By contrast, just about 30% of all tracts in the region are either at risk or becoming exclusive, or already stable/advanced exclusive, to low income households. This includes 61 tracts that were labeled as in early or advanced stages of gentrification in 2015, reflecting continued shifts in housing market accessibility for low income households. Exclusive tracts are concentrated in suburban counties, including Marin and San Mateo (nearly 70% and 50% are of tracts were classified as such respectively); wealthy enclaves in eastern Oakland and Berkeley; and pockets of San Francisco (making up 30% of all tracts).
- Compared to 2015 maps, fewer areas of San Francisco are classified as ‘At Risk of Gentrification,’ and are instead classified as ‘Stable Moderate/Middle Income.’ This new type captures working-class neighborhoods that are not experiencing the housing market pressures of the rest of the county, so the displacement of low-income households is relatively rare. In contrast, Oakland and South Berkeley continue to display numerous tracts at risk of or undergoing gentrification/displacement.
- New maps allow users to overlay other data onto gentrification and displacement maps. Overlaying redlining maps digitized by the Mapping Inequality Project at the University of Richmond, the crossover between areas once redlined and low-income and gentrifying tracts is stark, particularly in the East Bay. This relationship is consistent with other cities included in UDP/SPARCC research.