Today we are launching sensitivecommunities.org, an interactive mapping website that allows users to dive into the intersection of vulnerability and displacement pressures across the state of California. This map was designed to inform zoning reform proposals; below we discuss why we took this on, the process, and what this map tells us.
SB50 and Sensitive Communities
Zoning reform like SB50 — proposed legislation to increase allowable density near transit and other areas — aims to address supply challenges with a goal of bringing down housing prices overall. In order to address direct displacement concerns, the bill seeks to make sure that inclusionary provisions ensure the delivery of affordable units, as well as protect renters from displacement via demolition. At the same time, communities have raised equity concerns that market-rate production in these places may increase indirect, economic displacement pressure on residents in the near term.
On January 6, Senator Scott Wiener released new amendments to SB50 in part to address concerns from jurisdictions around local control, giving local governments two years to plan how to achieve the density prescribed by SB50, with SB50 provisions going into effect if the jurisdictions do not hit their goals within two years.
A “sensitive communities” provision was already in the bill language to designate vulnerable communities concerned about exacerbated displacement pressures as “sensitive communities”— places that would receive five years for community planning to guide potential upzones towards more equitable outcomes.
Evidence on the connection between development and displacement is not conclusive, but communities who have seen expensive new housing go up in their neighborhoods as displacement of low-income residents is underway have asserted that in the absence of clear evidence, precautionary anti-displacement measures may be sensible. The potential of displacement must be taken seriously; as we know from our research in the Bay Area and research from around the country, displacement represents a significant disruption and trauma with lasting impacts for households, and when rising housing prices lead to displacement of the most vulnerable residents, it can lead to re-segregation at the regional scale.
The Process of Mapping Sensitive Communities
At the request of stakeholders, the Urban Displacement Project worked this fall on a literature-informed and stakeholder-engaged methodology to identify sensitive communities, including change-over-time dynamics. In the process, we consulted equity advocates and academics specializing in the study of housing, displacement, and gentrification, as well as the SB50 author/sponsor team. In our last blog post, we discussed some of the key takeaways and methodological challenges in the process along the way.
Mapping Sensitive Communities
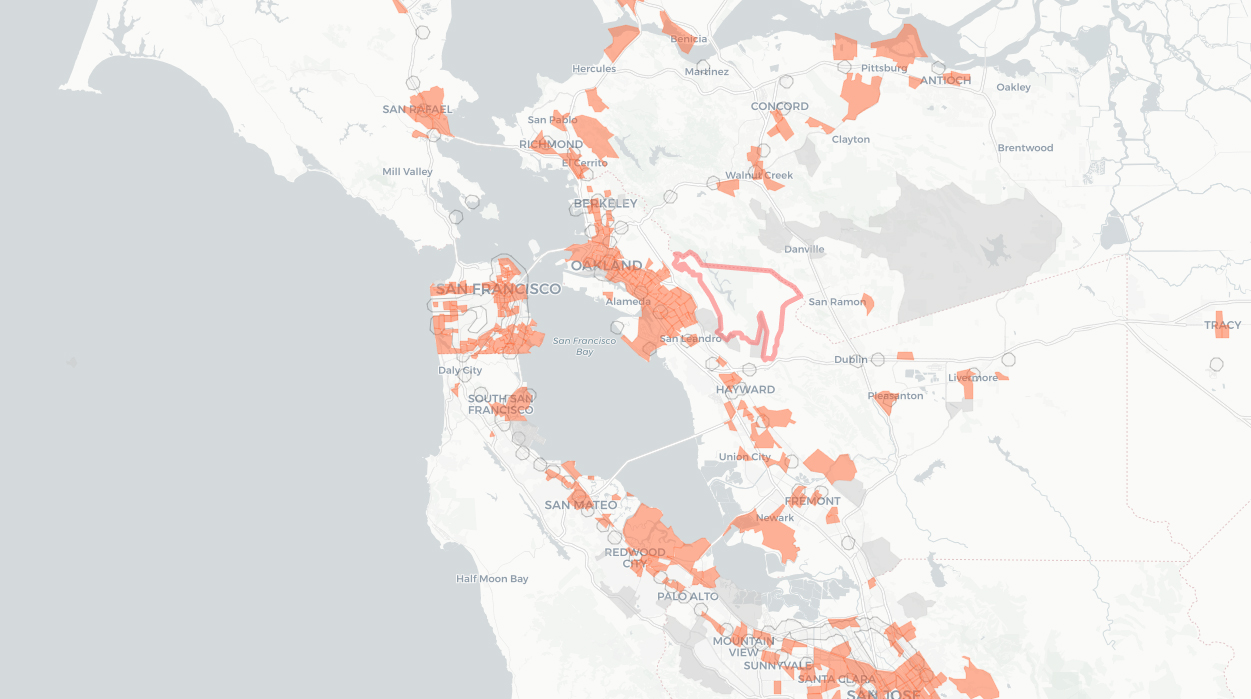
While there are many open questions about the best ways to identify sensitive communities across the state, and how a sensitive communities component of the bill would be implemented, we believe that data has an important role to play in this process. You can find our sensitive communities maps at sensitivecommunities.org.
Our evidence-based methodology for identifying sensitive communities was divided into two key components: neighborhoods with a high proportion of residents vulnerable to displacement in the case of rising housing costs, and market-based displacement pressures present in and/or near the community. Communities were designated sensitive if they currently have populations vulnerable to displacement in the event of increased redevelopment and drastic shifts in housing cost. Vulnerability includes metrics for the share of very low income residents, share of renters, share of people of color, and share of very low income households (50% AMI or below) that are severely rent burdened (spending 50% of income on rent). Market-based displacement pressures include percent change in rent between 2012-2017 above county median rent increases, and/or a rent gap (meaning rent is substantially lower than rent in surrounding areas). You can read about our methodology in more detail here, including about why we chose the metrics we did. Through this approach, we identified 27% of census tracts in the state of California as sensitive.
Findings from Mapping Sensitive Communities
So, what are these sensitive communities? Our biggest takeaway was that there is a lot of vulnerability in the state of California. We produced over 120 maps to analyze the different indicators that the literature and our stakeholders suggested in different ways. Looking at indicators of vulnerability alone without taking displacement pressure into account ends up covering much of the state — you can see our ‘vulnerability’ layer on sensitivecommunities.org to get a sense for this.
On average, the sensitive census tracts are 81% people of color, 64% renter, 34% very low-income (below 50% of the area median income), 26% of very low-income renters are severely rent-burdened (spending more than 50% of their income on rent), with average rent increases between 2012-2017 of 6%, and average rent gaps of $127.
Racial Disparities
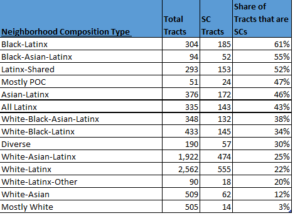 Looking at sensitive communities by racial composition, we can see that the neighborhood types that have the highest share of sensitive communities are Black-Latinx (61% of these types of neighborhoods in the state are designated as sensitive communities in our mapping methodology), Black-Asian-Latinx (55%), Latinx-Shared* (52%), mostly people of color (POC) (47%), and Asian-Latinx (46%). More diverse neighborhood types are most likely to be sensitive, while only 3% of mostly white neighborhoods are flagged as sensitive communities, and only 12% of White-Asian communities. In other words, sensitivity is concentrated in neighborhoods that follow the fault lines of generations of racist planning decisions that have segregated communities.
Renters and Rent Burden
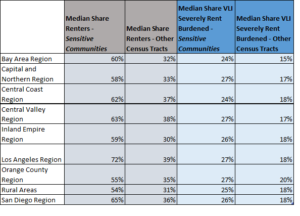
Looking at the vulnerability metrics of tenure and rent burden, we see that sensitive communities have a much higher share of renters and rent-burdened households as comparedto non-sensitive communities across the state. For example in the Bay Area, the median share of renters in sensitive communities (60%) is almost double the median share of renters in other census tracts (32%), with similar nearly 30 percentage point differences in the Los Angeles, San Diego, and Inland Empire regions as well as substantial differences throughout the state. Looking at the median shares of severely rent-burdened VLI renters, sensitive communities also look very different from other neighborhoods in their region. In the Bay Area, Los Angeles, Central Valley, and Sacramento regions there is roughly a 10 percentage point difference in rent burden for this population between sensitive communities and other census tracts.
Rent Gap
Taking a look at displacement pressures, such as the rent gap, or the difference between the rent within a tract versus nearby tracts, we find that non-sensitive communities tend to not just have lower rent gaps than sensitive communities, but actually have negative rent gaps. In other words, non-sensitive places tend to be more expensive than their neighbors. Amongst sensitive communities, median rent gaps in many regions approach $200, including in the Bay Area, Central Coast, and Inland Empire, with a median rent gap of $244 in the Orange County region. This means that many of these sensitive communities are very close to neighborhoods with much higher rents. Given the vulnerable populations living in these places, this can be a recipe for landlords to see a profitable opportunity in new higher-income tenants.
Moving Forward
As we wrote in our last blog, the devil is in the details in terms of how this bill will be implemented. It is critical that details — such as the resources, process, and parameters for both identifying and implementing sensitive communities — be well-defined. This will include determining how sensitive communities are ultimately identified; how updates are made to sensitive community definitions on an ongoing basis; how to include communities that are not well represented by census tract boundaries; and how to take into account local knowledge for local planning processes.
We believe that the maps at sensitivecommunities.org are a starting point for continued conversations, and a reference point for further analysis. Many stakeholders, academic and advocate, were involved in this work, engaging in several rounds of feedback. While consensus was not reached on every census tract, after many iterations, we feel that our academically informed statewide approach has maximized the utility of publicly available data. This exercise demonstrates just how much vulnerability there is throughout the state — underscoring the importance of making sure any transformative land use policies are thoughtful around mitigating potential negative impacts on the state’s most vulnerable residents.
*“Shared” in Latinx-shared” means that < 90% of the population is Latinx but each of the other groups represented are < 10% of the total population.